
BioQuest
February 2015 - December 2017
Bio Quest App
D2 Software for Health Research and Laboratory Management
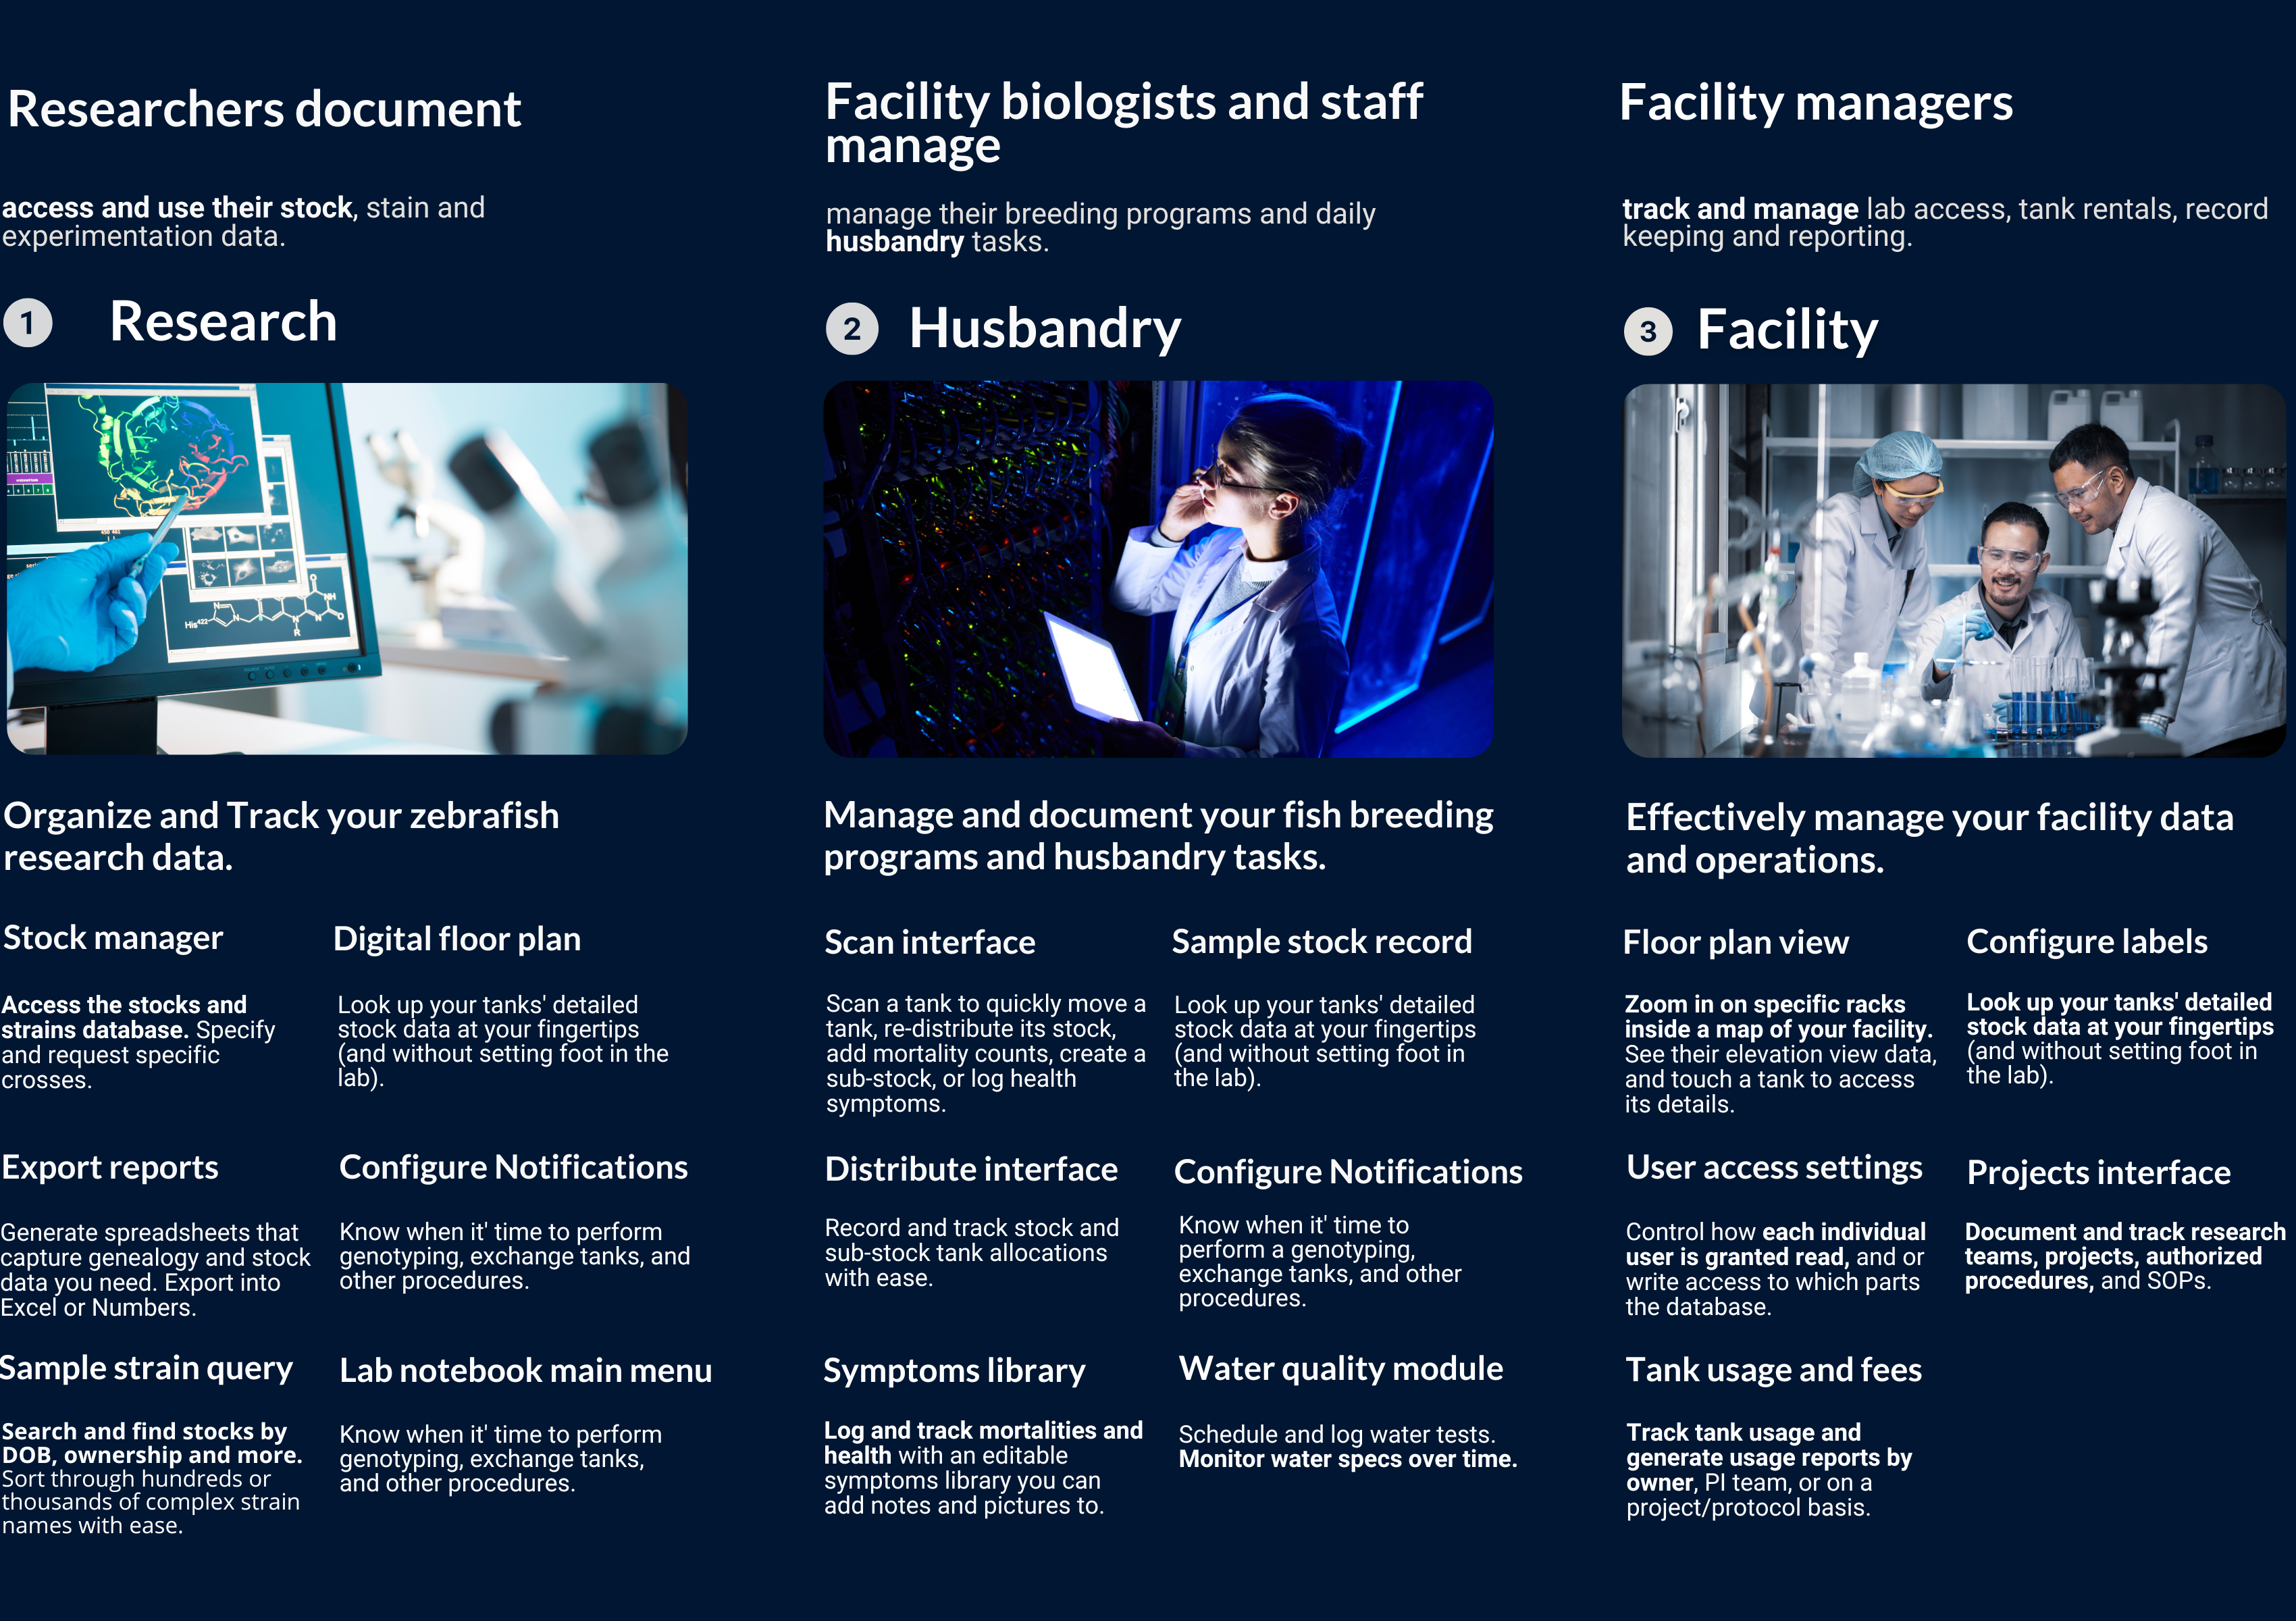
Overview
Who was the client?
The client for this project was the health field research laboratories, which includes universities, hospitals, pharmaceutical companies, and various industries engaged in in vivo biomedical research using zebrafish and mice.
What was my role?
As the Interaction Design Lead for the Fulcrum Bio Quest app, I was responsible for guiding the app's user-centered design, leading a design team, strategizing design processes, collaborating with cross-functional teams, conducting user testing, and staying updated on design trends.
Problem
The previous software exhibited various constraints. It was exclusively tailored for tablets, which resulted in limited accessibility for users. Furthermore, it presented a perplexing user experience by not adhering to established user experience principles. This lack of user-friendliness posed significant challenges for users in performing their diverse tasks within research laboratories.
Solution
The solutions included creating intensive user communication, redesigning multidimensional software for collaborative information sharing, and real-time staff monitoring. It aimed to enhance communication and experimentation. Additionally, a unified system was developed to ensure consistency across platforms and devices.
Tools
Adobe Creative Suite (Illustrator, Photoshop), Sketch, InVision.
Google Analytics, Balsamiq, Axure.
A/B Testing, Responsive Web Design (RWD), User Flows, UX Research, Visual Design.Slack, Trello, HTML, CSS
Team
1 Interaction Design Lead
2 UX Researcher
1 Content Designer
2 Business Analyst
6 developers
1 project manager
My Role
UI/UX Design
User Research
Wireframing
Prototyping
Information Architecture
Collaboration and Communication
Timeline
Overall: 2 Years+ weeks
Discovery and Research: 55+ weeks
Design and User testing: 20+ weeks
Production 24+ weeks
Stakeholders and Market
In vivo biomedical research worldwide (OOM):
25,000 laboratories
250,000 lab users (75K staff + 175K researchers)
200 million animals (not incl. flies, nematodes…)
Universities; hospitals; pharma; industry; other
$120 million addressable market (based on our currently planned software scopes).

User Interview Methods
During the ideation phase of the project, I conducted user interviews to build new personas and to inform the design. Together with the team, we prepared an interview script with 32 open-ended questions, focusing on our target audiences’ values, motivations, and daily routines. In 4 days, I recruited and interviewed 7 users remotely. We referenced the user interview findings throughout the entire design process.
Here are some user interview methods that are used:
Structured Interviews
A list of specific questions is prepared in advance.
Semi-structured Interviews
A general outline of questions is prepared, but the interviewer can adapt based on the participant's responses.
Unstructured Interviews
No predetermined questions; the conversation flows naturally.
Remote,and In-person Interviews
Conducted using video conferencing or phone. Conducted face-to-face
Tools Used for User Interview Methods
Interview Scheduling and Management
Calendly, Google Calendar
Interview Recording and Transcription
Zoom, Otter.ai
Note-Taking and Analysis
Evernote, Microsoft OneNote, NVivo
Remote Interview Tools
Zoom, Google Meet, Skype
Understanding the User Persona
Based on the interviews, we identified three groups of Personas
Page Structure, Wireframe
Layout anatomy- Design Wireframes
Predictable
Intuitive and predictable layouts with consistent UI regions and spatial organization.
Consistent
Bioquest layout use grids, keylines, and padding consistently.
Responsive
Bioquest Layouts are adaptive. They react to input from users, devices, and screen elements.
Adaptable to any screen size and orientation
Bioquest layout use grids, keylines, and padding consistently.
Graphical genealogy tree
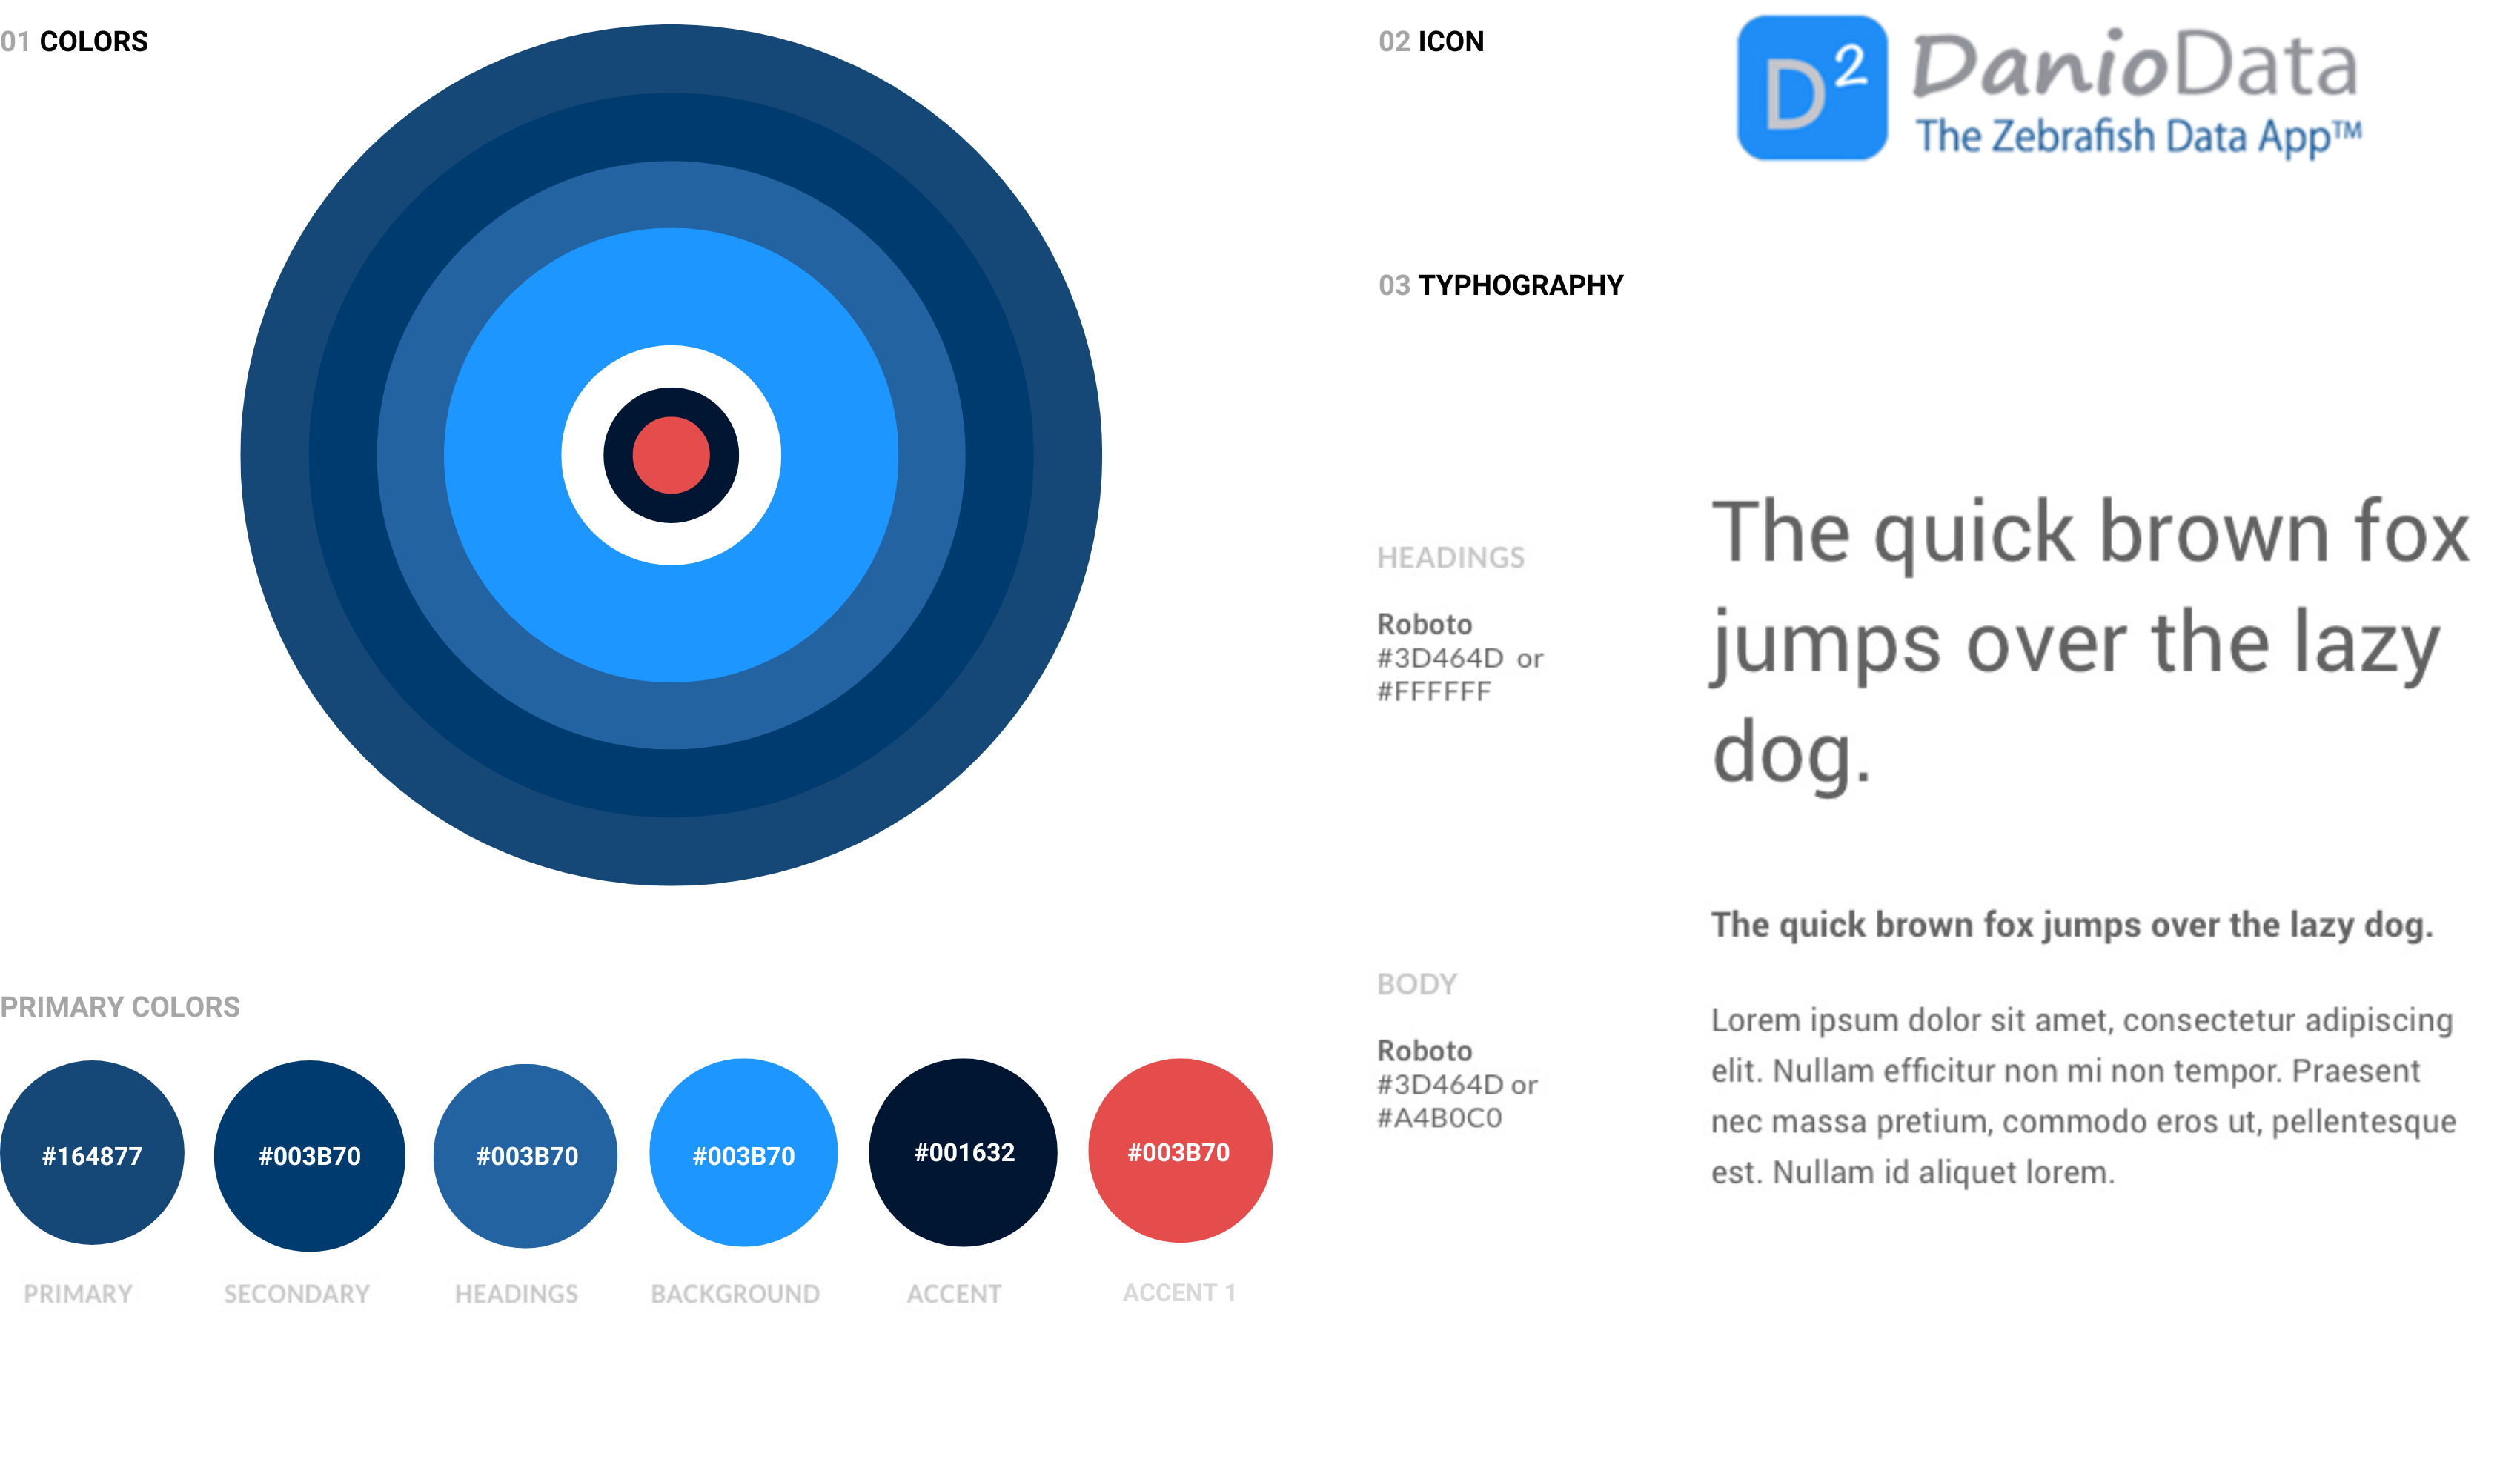
Style Guide
Color, Typography, Shapes
The dark blue UI gives Bioquest App a premium feel, while also allowing its bright accent colors that represent data to stand out against the background. The high contrast between data and the background color make it easy to read its graphs and charts.
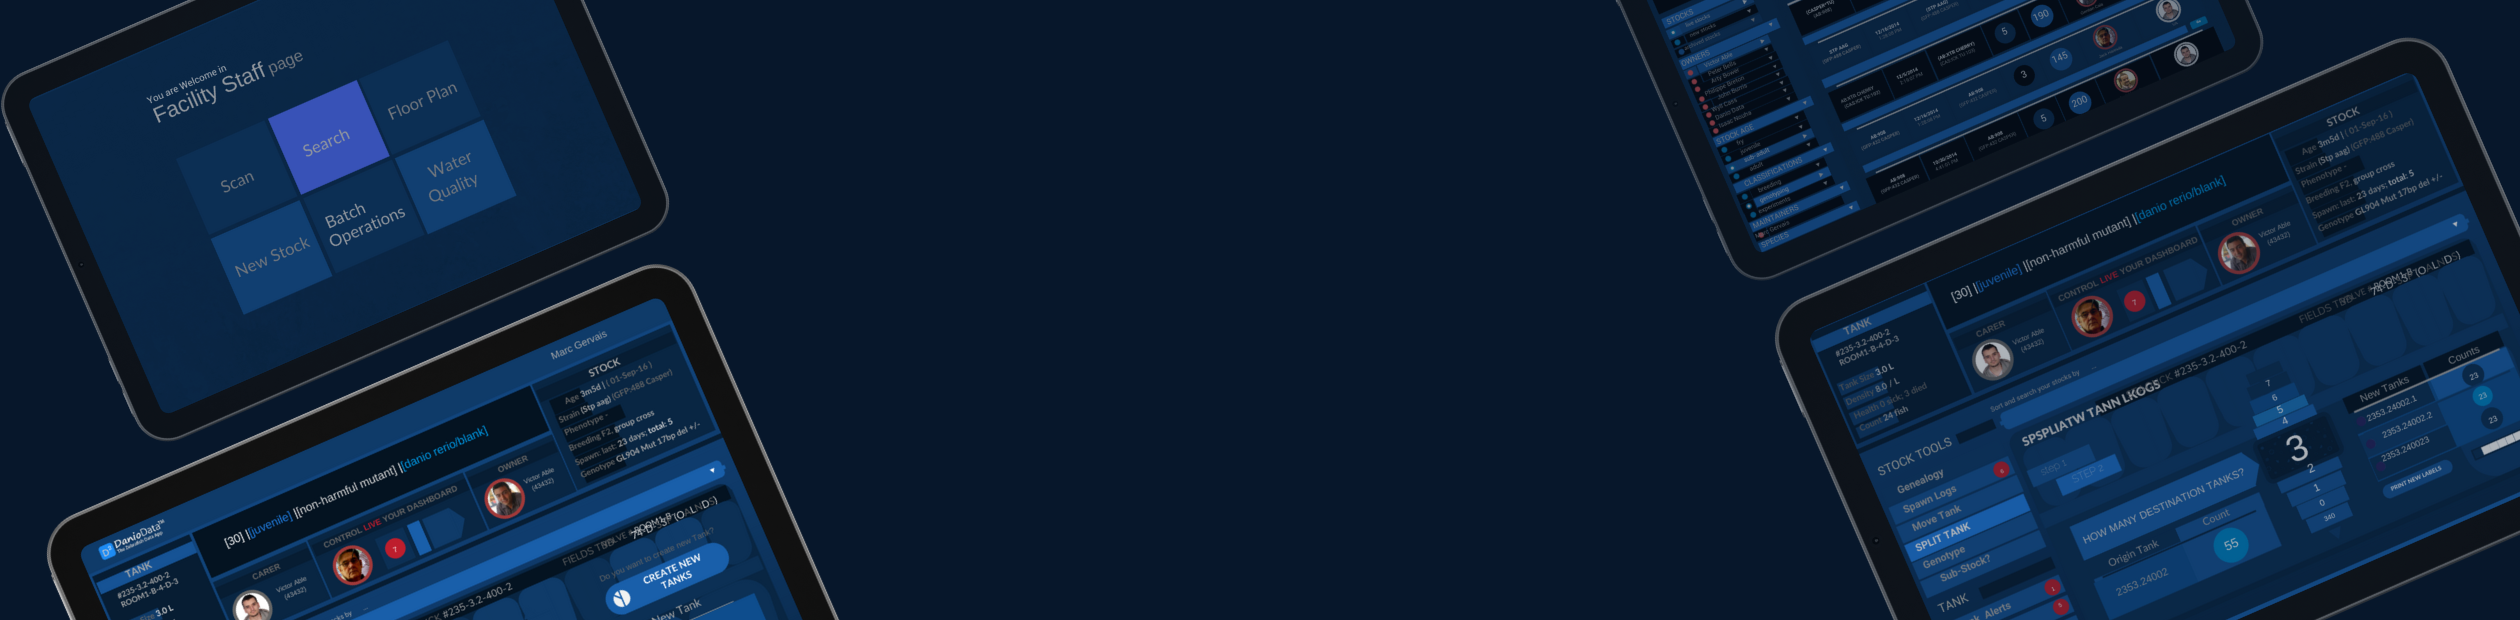
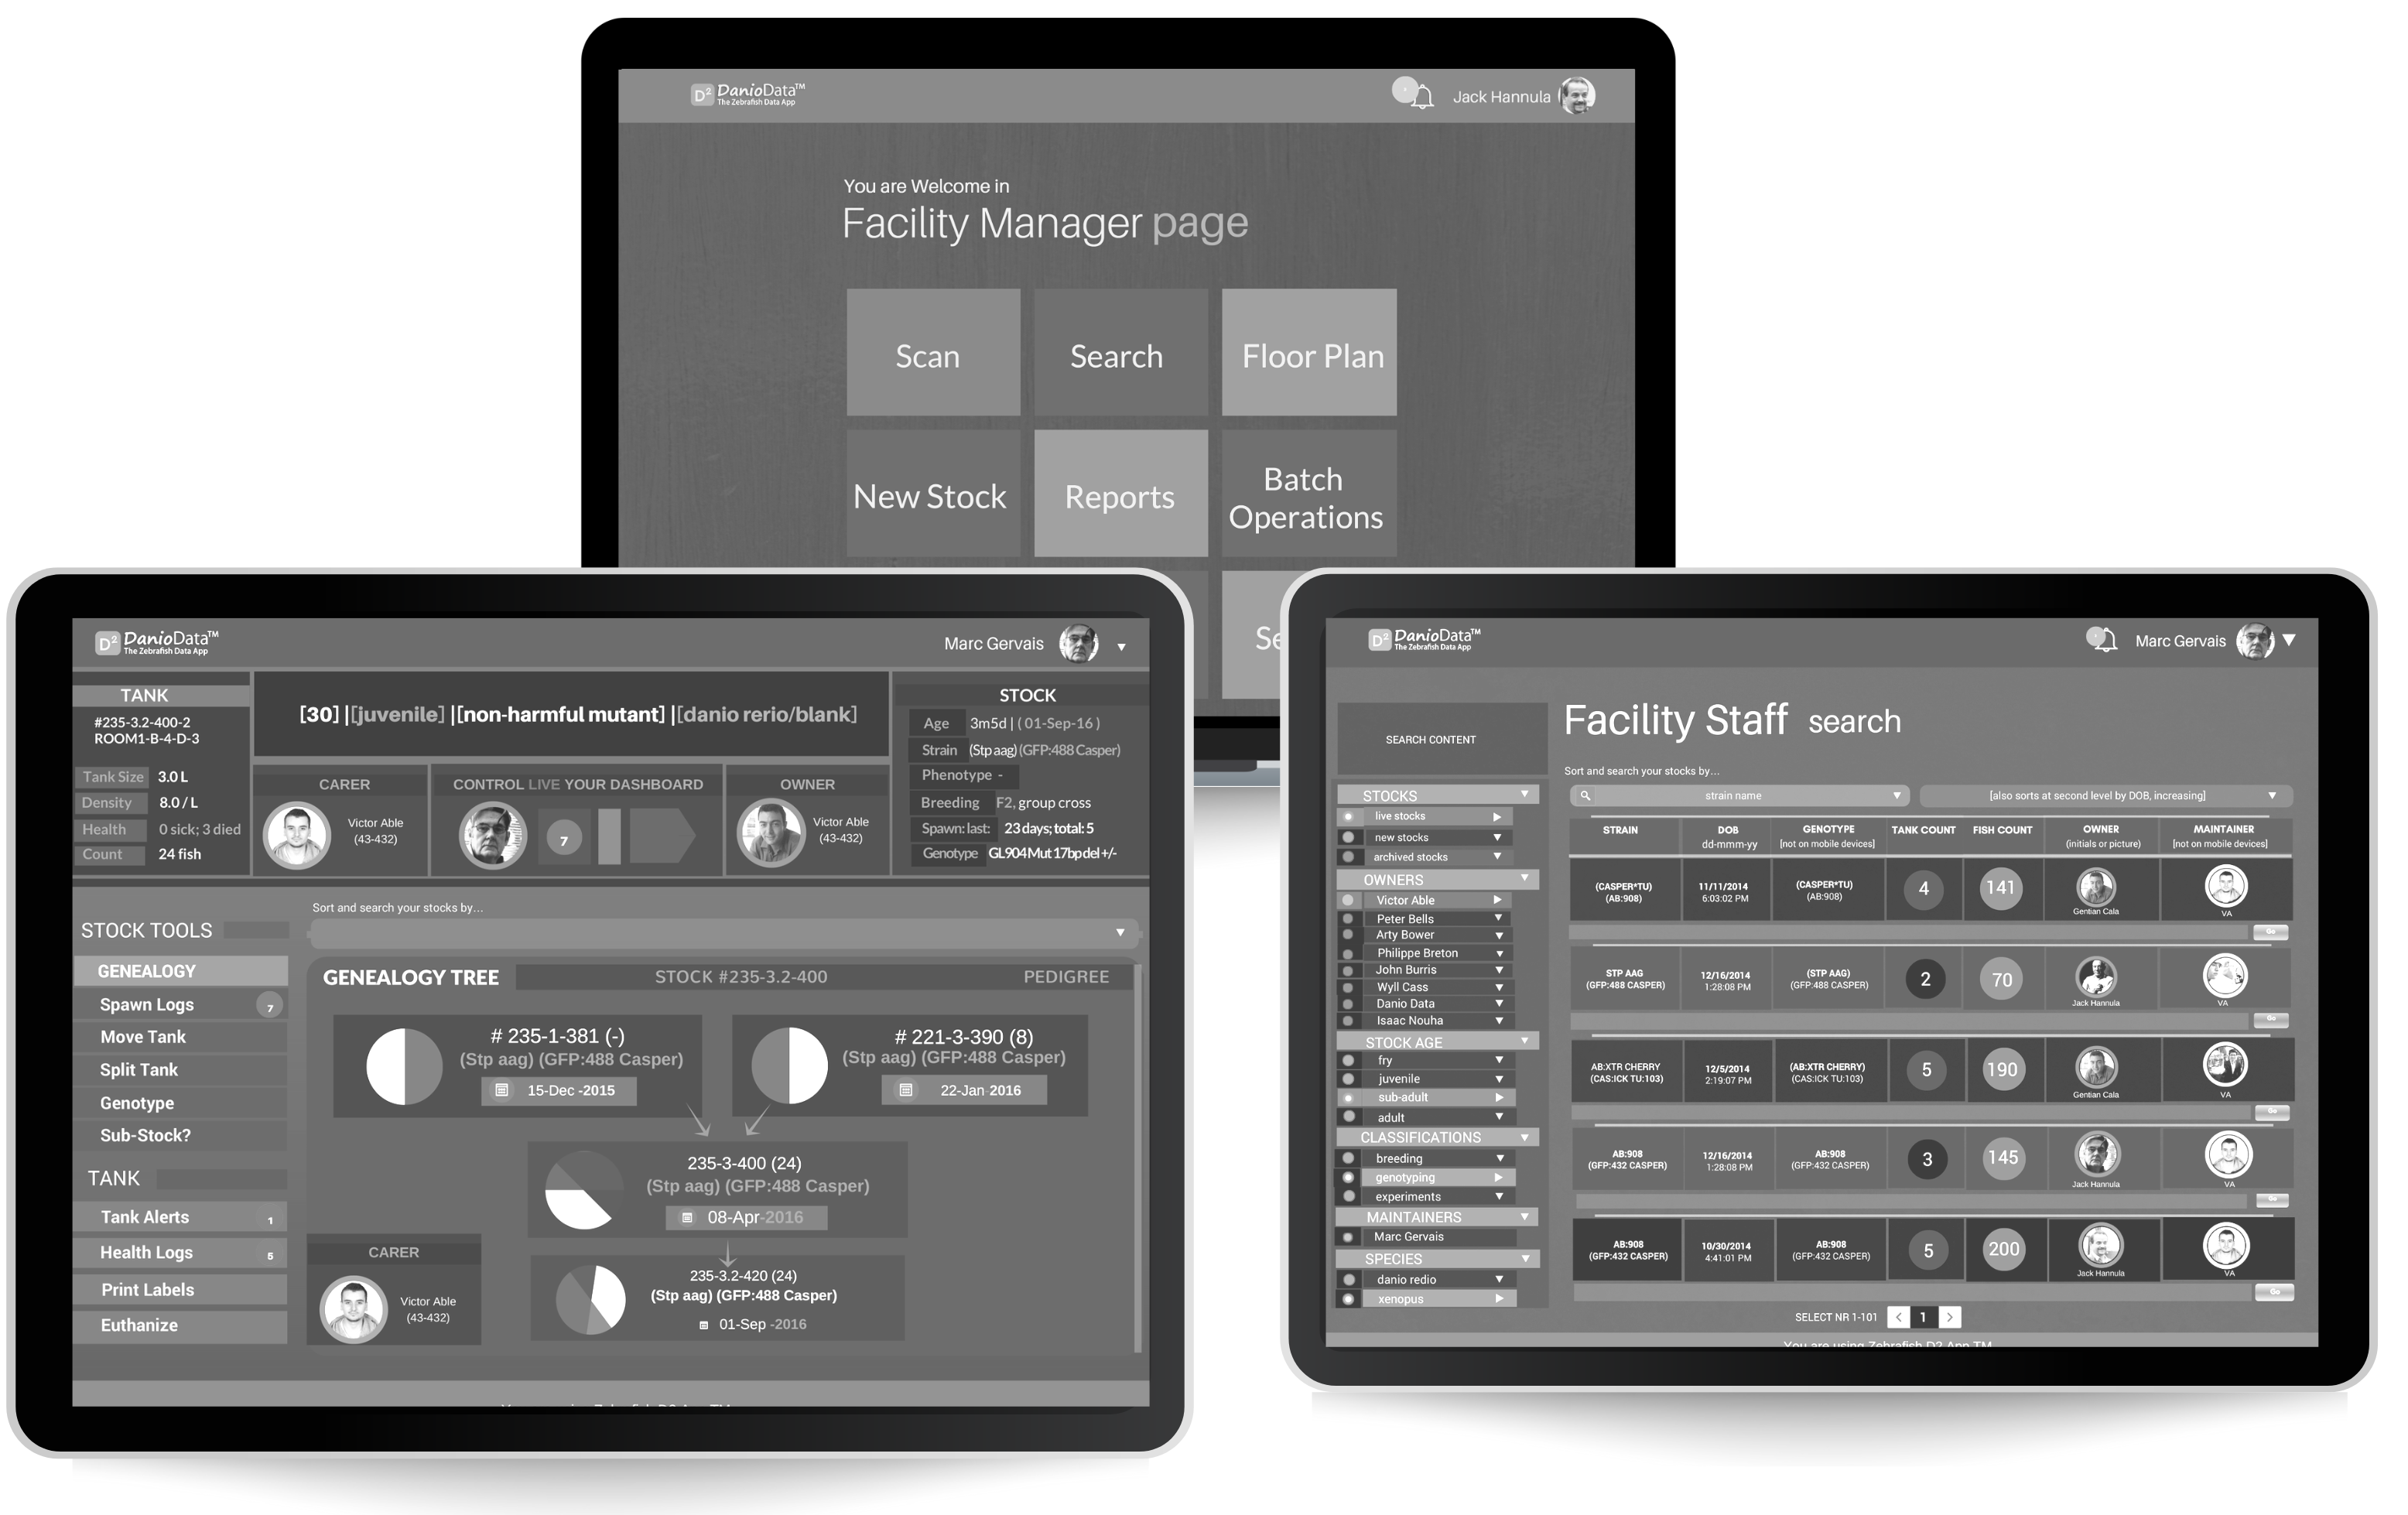
Facility Manager Pages
High Fidelity Wireframes
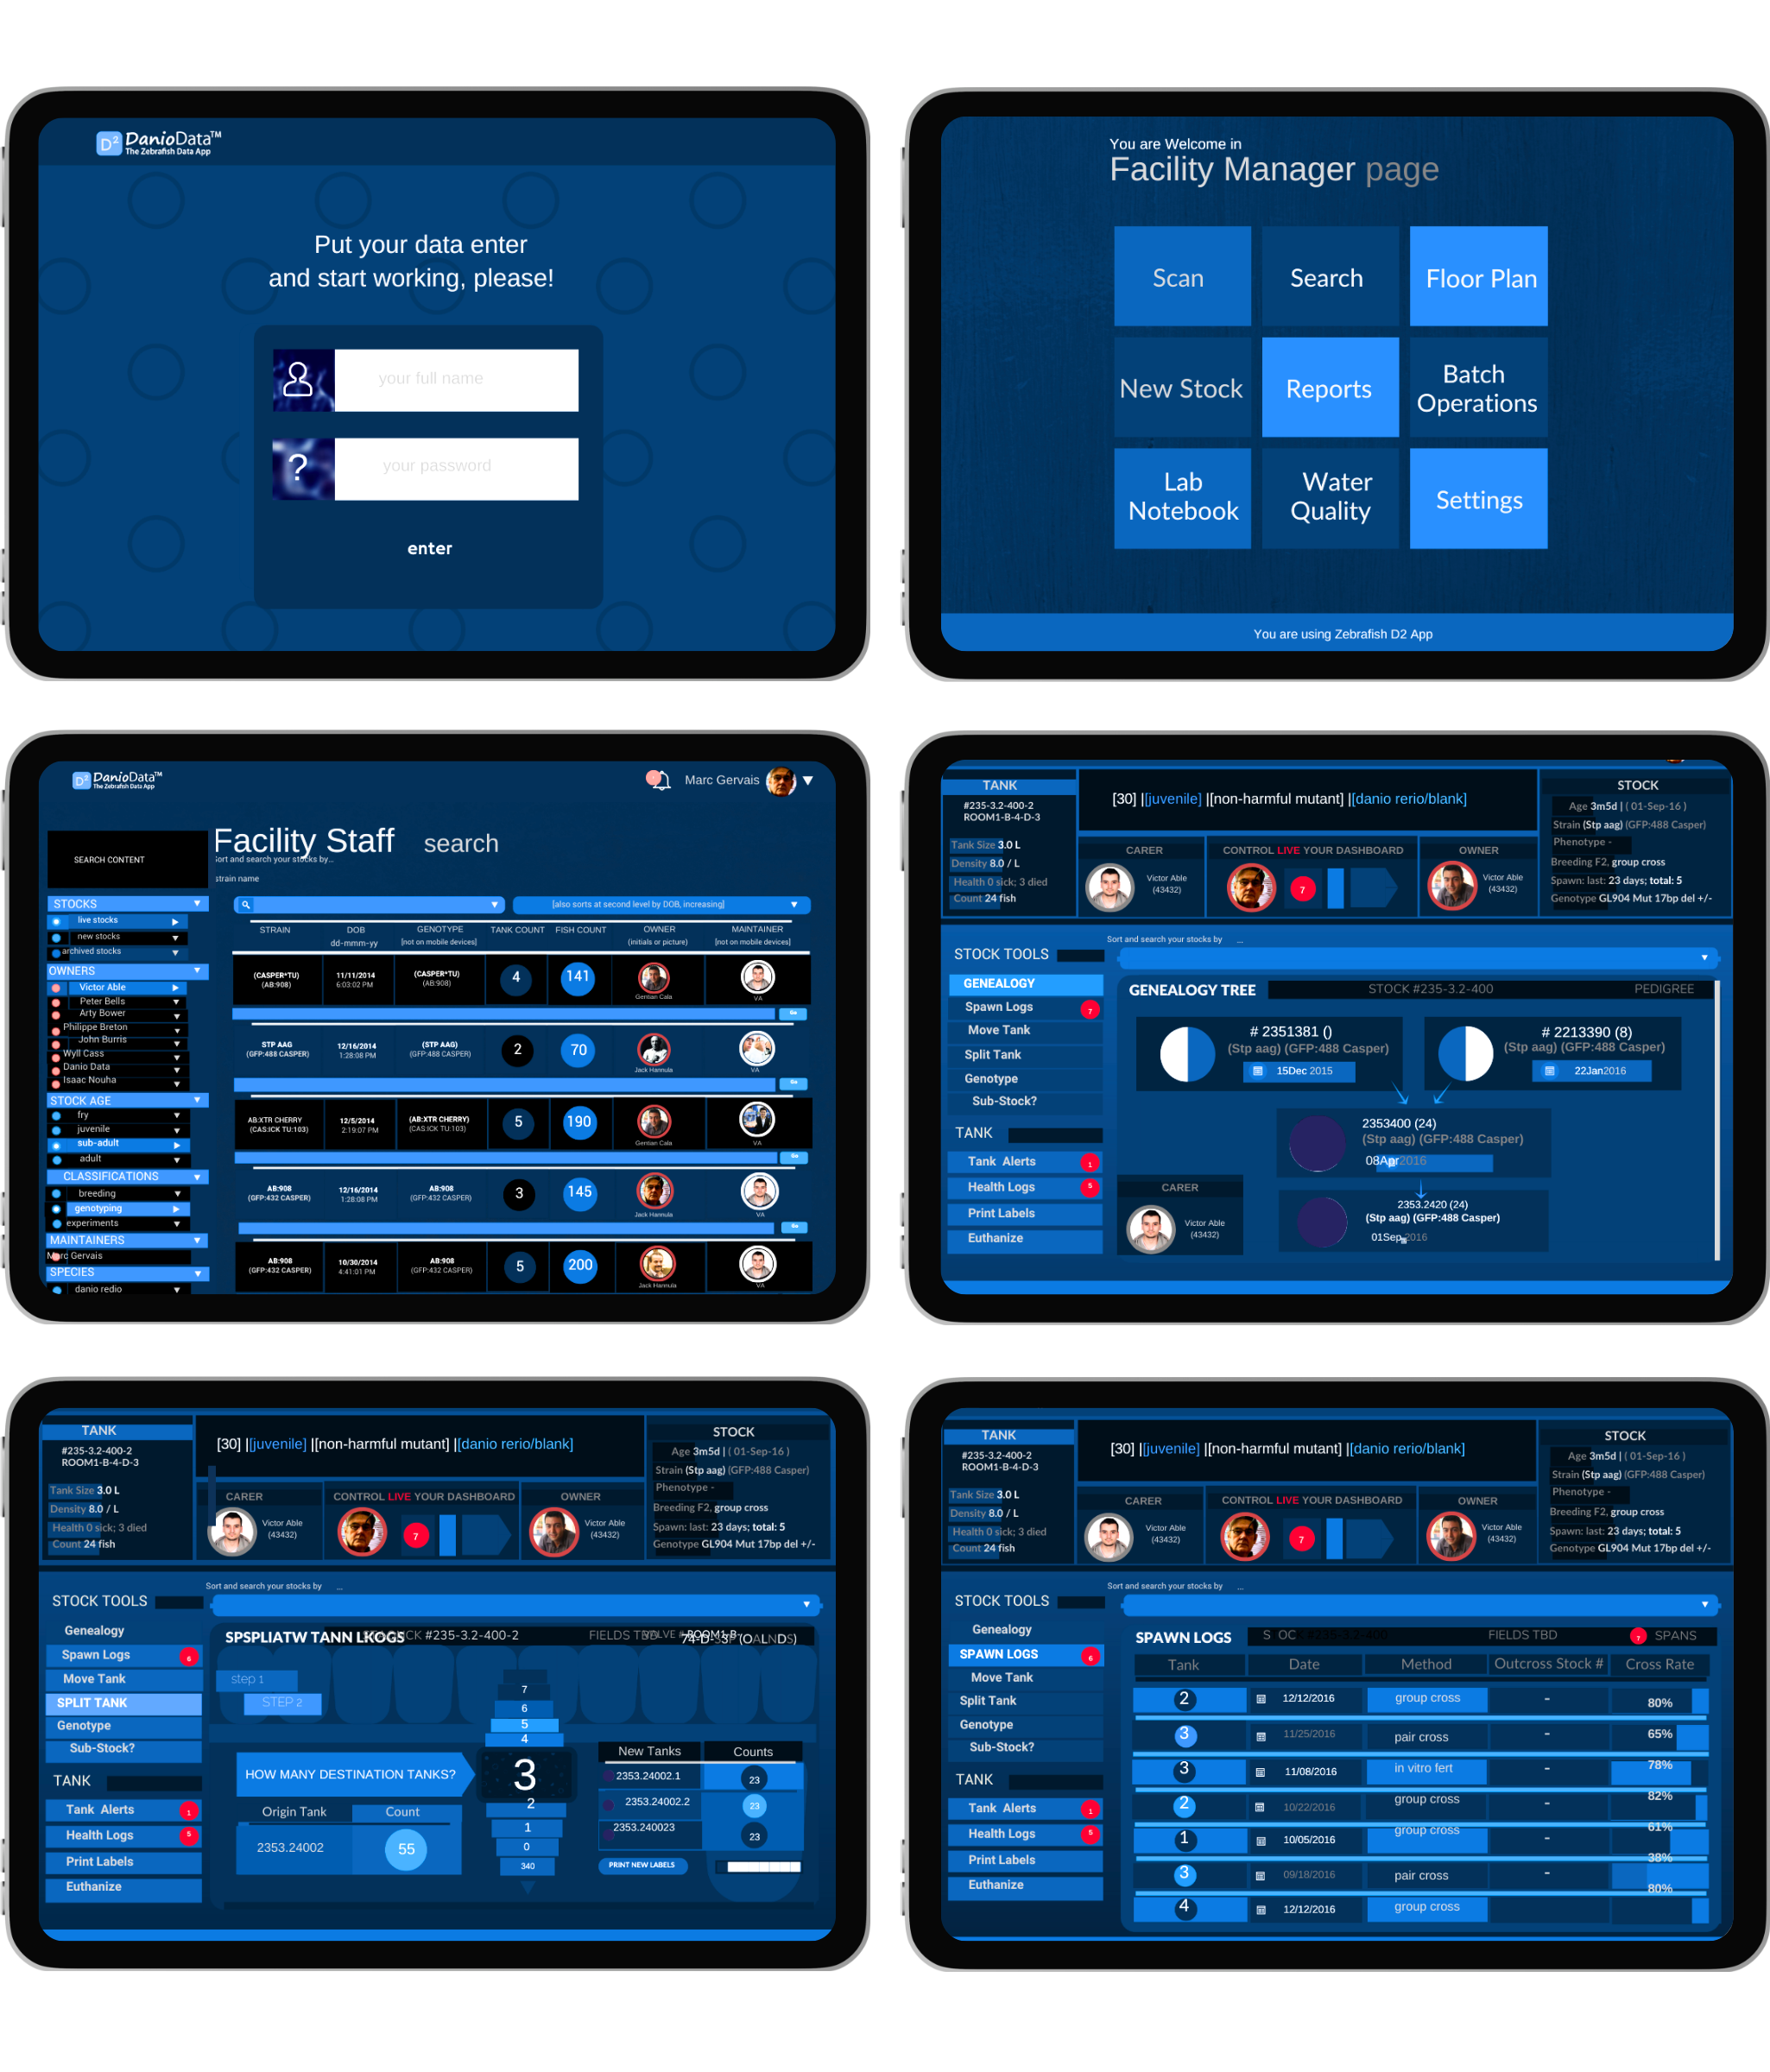
Admin Dashboard
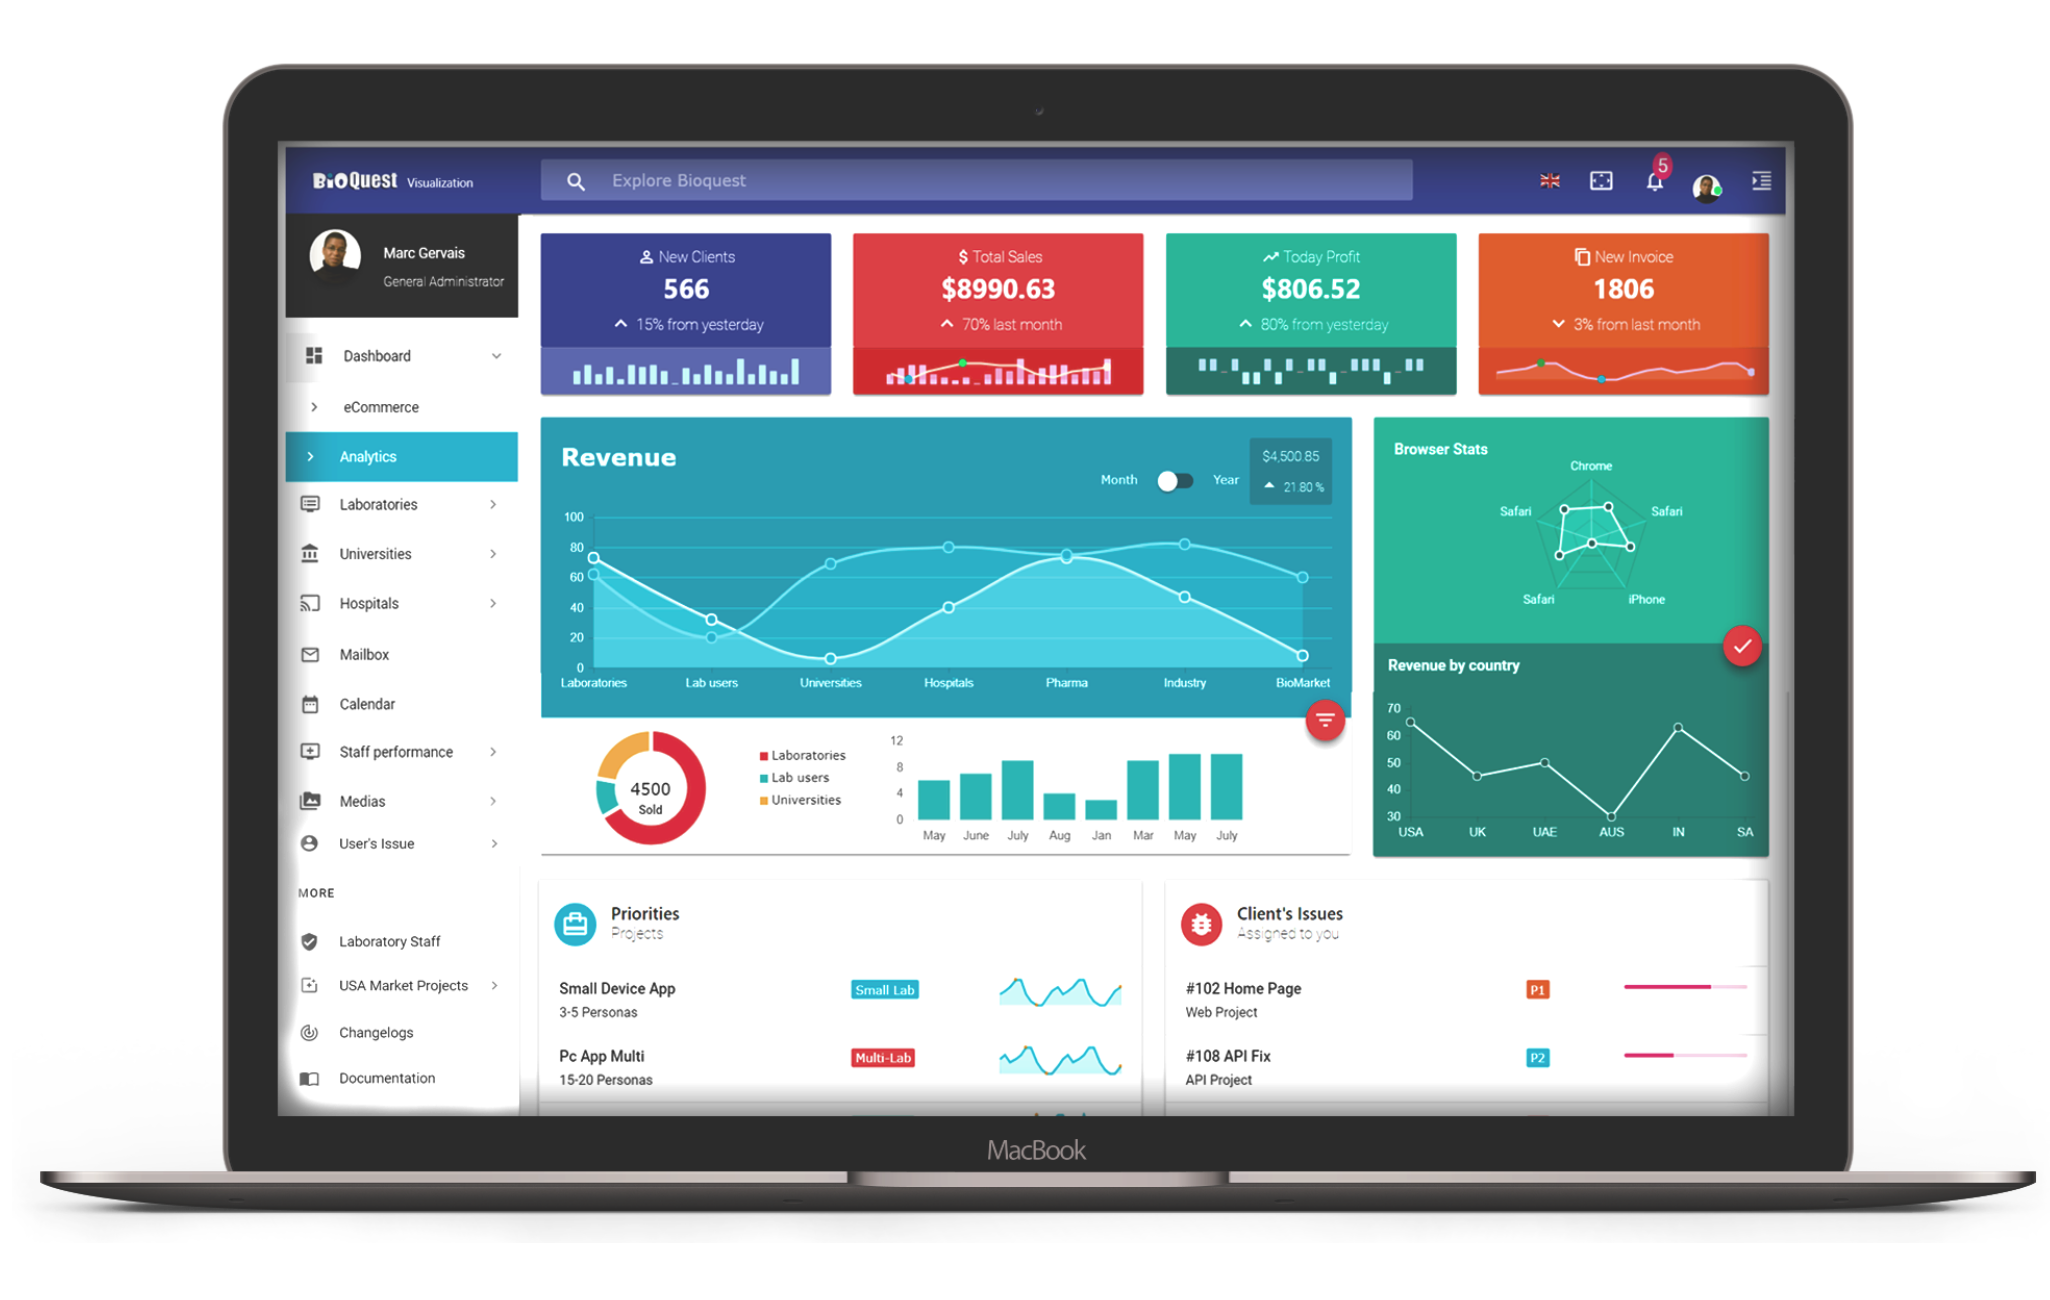
Content
Content is divided into sections related to personal finance, such as accounts, budgets, and bills. Bioquest Admin home page operates as a hub to these sections. A permanent location for navigation makes it easy for users to switch sections easily. On desktop and tablet, Bioquest uses rail navigation.
Bioquest's navigation provides a permanent region to navigate between sections, while taking up little screen space. In a rail, each destination is represented by a unique icon with text. When a section is selected, it's item becomes brighter and a section titles is displayed.
Sections
Because Bioquest is concentrated on presenting and describing different areas of Company finance, it’s important that users can easily move between sections.
New Clients, Total Sales, Profit, New Invoices, Revenue Chart, Revenue by Country, Priorities etc. are by default result in Admin Analytics-Subpage.
Key Performance Indicators
15x increase
Sales Growth: The D2 software experienced a remarkable 15-fold increase in sales within the first year, demonstrating its significant impact on the market.
10x faster
Usage Speed: The application's efficiency and effectiveness in meeting user needs is evident in its 10x faster usage speed compared to previous systems.
200% increase
Customer Base Growth: The D2 software's ability to attract and retain new customers is highlighted by the 200% increase in the customer base within the first year.