Overview
Intro | Investigate
BioQuest (Danio-Data) is producing software Company for health field researcher laboratories (based in Zebra-fish and mice). Danio Data, or D2 software, was produced and developed, 7 years ago.
Challenges | Goals
Old software was working only for tablets, and provided, customers confusing services, to by not respecting the user experience principles, was not friendly, and very limited to help users to do their tasks (in those search laboratories users are different persons with different tasks ).
Competitor Analysis
Performing an audit/review of competing websites and apps; conducting user testing of competing sites; writing a report that summarises the competitive landscape.


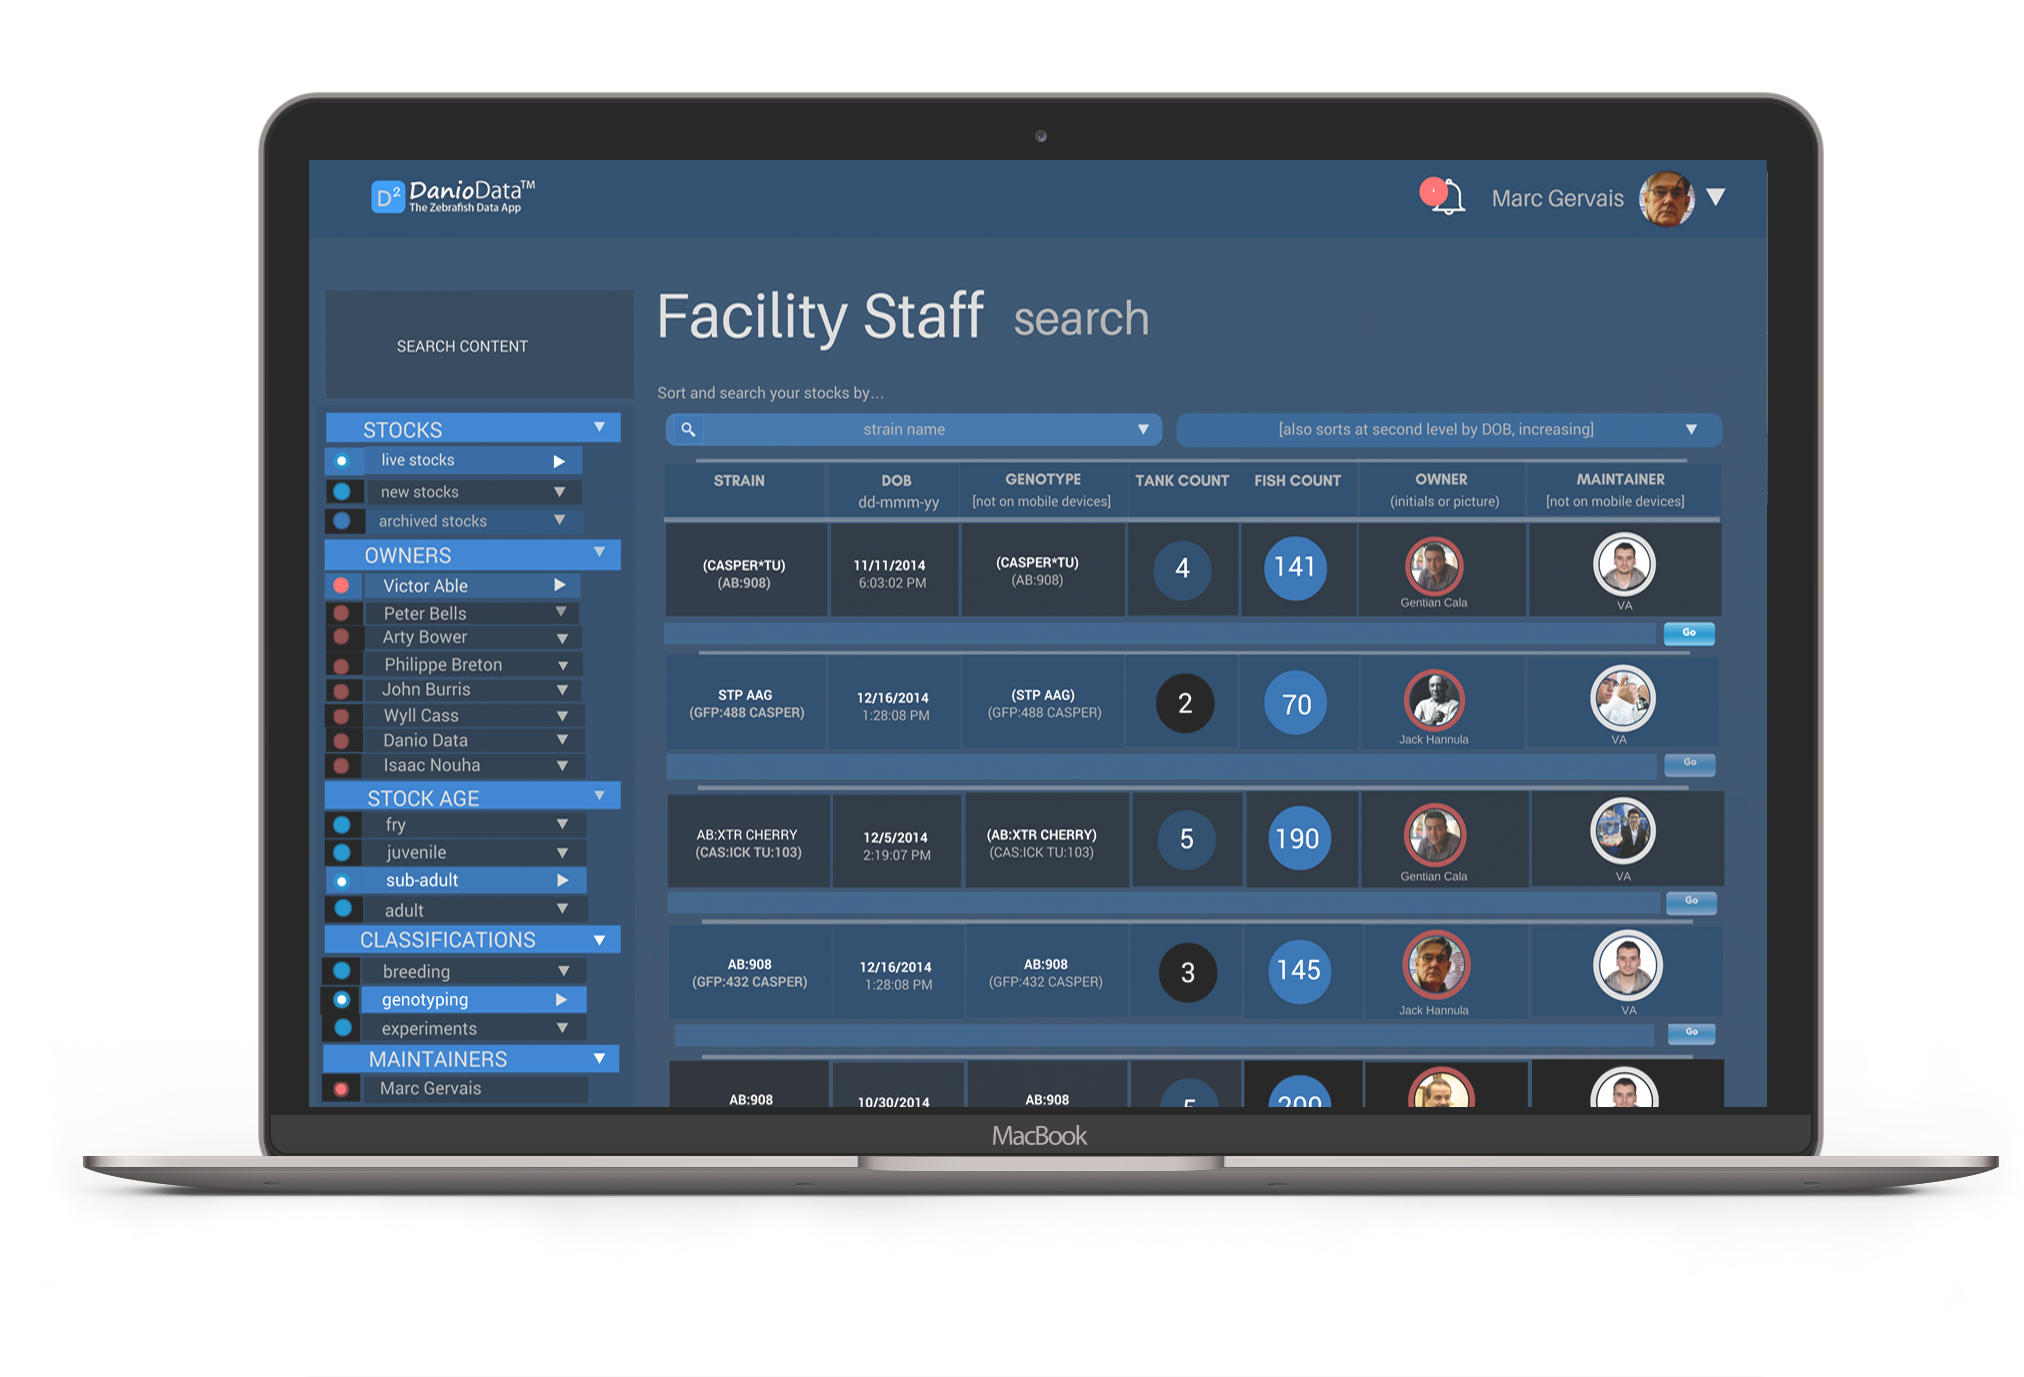
What is Bioquest App

Relational model app, specifically designed for the zebrafish research lab
Researchers document, access and use their stock, stain and experimentation data.
Facility biologists and staff manage their breeding programs and daily husbandry tasks.
Facility managers track and manage lab access, tank rentals, record keeping and reporting.
Project tasks
To create intensive communication with users, to redesign a multi-dimensional software where users share information with each -other, and to get informed about the staff result in every moment, to create greater opportunities for communication and experimentation.
To develop a single underlying system that allows for a unified experience across platforms and device sizes.
Stakeholders and Market
In vivo biomedical research worldwide (OOM):
25,000 laboratories
250,000 lab users (75K staff + 175K researchers)
200 million animals (not incl. flies, nematodes…)
Universities; hospitals; pharma; industry; other
$120 million addressable market (based on our currently planned software scopes).

Understand Bioquest App Users
Strategy and Research
I have worked closely with UX researchers to conduct user research to understand who their target users are and what the users'.
What problem are we trying to solve?
What are they looking for in your product?

Page Structure, Wireframe
Layout anatomy- Design Wireframes
Predictable
Intuitive and predictable layouts with consistent UI regions and spatial organization.
Consistent
Bioquest layout use grids, keylines, and padding consistently.
Responsive
Bioquest Layouts are adaptive. They react to input from users, devices, and screen elements.

Adaptable to any screen size and orientation
Digital lab floor plan and rack elevation views
Graphical genealogy tree
Style Guide
Color, Typography, Shapes
The dark blue UI gives Bioquest App a premium feel, while also allowing its bright accent colors that represent data to stand out against the background. The high contrast between data and the background color make it easy to read its graphs and charts.

Mockups Design
The UI is dense and direct, with an emphasis on typography, color, and shape.

Admin Dashboard
Design Mockups
Content
Content is divided into sections related to personal finance, such as accounts, budgets, and bills. Bioquest Admin home page operates as a hub to these sections. A permanent location for navigation makes it easy for users to switch sections easily. On desktop and tablet, Bioquest uses rail navigation.
Bioquest's navigation provides a permanent region to navigate between sections, while taking up little screen space.
In a rail, each destination is represented by a unique icon with text. When a section is selected, it's item becomes brighter and a section title is displayed.
Sections
Because Bioquest is concentrated on presenting and describing different areas of Company finance, it’s important that users can easily move between sections. New Clients, Total Sales, Profit, New Invoices, Revenue Chart, Revenue by Country, Priorities etc. are by default result in Admin Analytics-Subpage.
Design Concept
A premium style
Data-driven aesthetic


Components Design


D2 UI Components
Usage, Anatomy, Behavior, Specs and Implementation for:
Forms : Autocomplete, Checkbox, Contact Form, Date and Time Picker, File Input, Multiselect, Radio Button, Search, Select, Slider, Switch, Validation
Components : Alerts, Buttons, Cards, Dropdown and Select, Tooltips, Collapse, Modals, Charts .
Navigation: Compositions, Bredcrumbs, Footer, Hamburger Menu, Scroll Spy, Side Nav.
Data tables
Data tables can include: A corresponding visualization, Navigation, Tools to query and manipulate data.
Cards
Cards contain content and actions about a single subject. Contained A card is identifiable as a single, contained unit. Independent A card can stand alone, without relying on surrounding elements for context. Individual A card cannot merge with another card, or divide into multiple cards.
Product architecture

Information Architecture
D2 information architecture has a hierarchical structure, allowing users to look at their searhes and saves data through a variety of categories.
Content
Logo, Global Search, Clear Top Menu, Clear Messages, About US Section, Why Bioquest Section(3 Main Qualities), Staff Section, News and Events section, Footer (add links)
Bioquest navigation
On desktop and tablet, D2 uses navigation. Bioquest navigation provides a permanent region to navigate between sections, while taking up little screen space.
Tab selection
Unselected tabs are represented by icons. When a tab is selected, it displays a section title adjacent to the icon. Tabs make navigation persistently available while taking up as little space as possible.
Layout
Grid System
D2 uses a responsive grid system, which has flexible columns and padding that can resize to accommodate any screen width.
Elevation
D2 expresses elevation differences between UI elements using color or a scrim.
Color
Sometimes D2 needs to show multiple infographics on a single screen, each with multiple sections. To do this, D2 has adopted a color theme with one primary color, and five additional colors. This elaborate color theme allows D2 to present readable, distinct infographics.
Typography | Typefaces
D2 uses two typefaces: Roboto and Roboto Condensed.
Iconography
D2 uses custom iconography to represent to its four main sections: Logo, Global Search, Clear Top Menu, Clear Messages, About US Section, Why Bioquest Section(3 Main Qualities), Staff Section, News and Events section, Footer (add links).
Surface edges
Material surfaces use shadows to indicate edges. Other methods can be used to indicate edges, such as: Giving surfaces different colors, Giving surfaces different opacities.
Motion
D2 has a simple and reserved motion style to help balance the visual density of the UI.